O-Xylene (C8H10)
The MO Calculations for O-Xylene (C8H10)|
For O-Xylene, the overall best
calculated dipole moment was found using the 6-21G level of theory. The
6-21G level gave a 1.10% error for the dipole moment. The data collected
for each level of theory can be found in Table 1.
Table 1: Dipole moment for each level of theory.
Figure 1 though Figure 3 showed the geometries under 6-21G, 6-31G, and DZV levels of theory. The bond lengths and bond angles are both shown in those figures listed below.
| ||||||||||||||||||||||||||||||||||||||||
|
| ||||||||||||||||||||||||||||||||||||||||
|
| ||||||||||||||||||||||||||||||||||||||||
|
The
Highest Occupied Molecular Orbital (HOMO) was at orbital 29. The HOMO
was calculated by dividing the sum of the total number of electrons in
the molecule by 2. The Lowest Unoccupied Molecular Orbital (LUMO) was at
orbital 30. The LUMO was the orbital that would get filled by the
excited valence electron(s) from the HOMO if proper excitation occurs.
| ||||||||||||||||||||||||||||||||||||||||
|
| ||||||||||||||||||||||||||||||||||||||||
|
The electrostatic potential of CO2 using the 6-21G ab initio
theory was shown using a rainbow spectrum in Figure 6. The red is used
to indicate the lowest potential while the blue indicate the highest
potential.
The partial atomic charge was shown in Figure 7. It demonstrated the distribution of eletrons by the asymmetric settling.
| ||||||||||||||||||||||||||||||||||||||||
|
| ||||||||||||||||||||||||||||||||||||||||
|
Figure 8 through Figure 13 showed possible primary motions associated with the peaks in the IR Spectrum shown in Figure 14. The bond movement with associated wavenumber was shown in Table 2.
Table 2: the bond movements and wavenumbers.
| ||||||||||||||||||||||||||||||||||||||||
| ||||||||||||||||||||||||||||||||||||||||
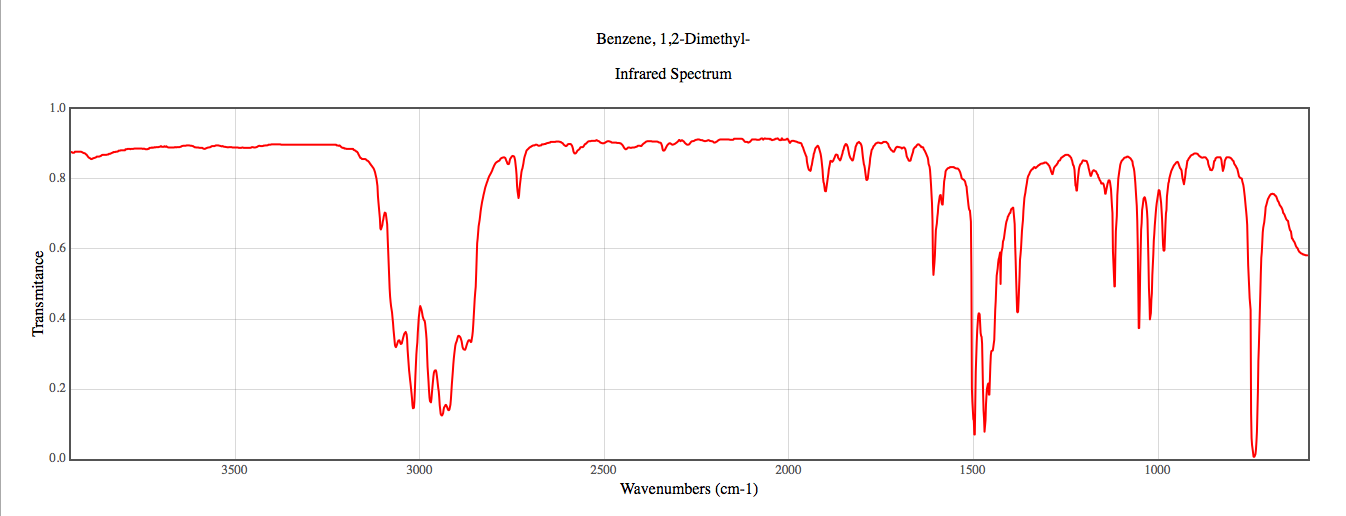 Figure 14: Infrared Spectrum for O-Xylene. | ||||||||||||||||||||||||||||||||||||||||
|
For UV-vis spectra, there was no graph that
available. Considered that benzene has similar structure to o-xylene,
Figure 15 shows the UV-vis spectra of benzene.
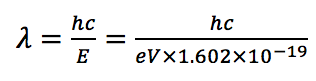
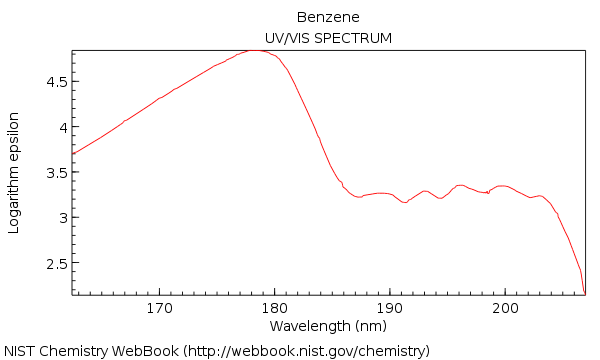 Figure 15: UV-vis spectra for Benzene.5 The absorbance of O-Xylene was calculated by the following equation:
The oscillator strength indicates the intensity of the oscillation movement in the molecule. The literature value of wavelength for O-Xylene was under 300 nm6. Compare to Figure 15, O-Xylene has two methyl groups more than benzene, that could explain the shift of the peak for O-Xylene. | ||||||||||||||||||||||||||||||||||||||||
|
| ||||||||||||||||||||||||||||||||||||||||
|
|
 (1)
(1)
Page skeleton and JavaScript generated by export to web function using Jmol 14.2.12_2015.01.22 2015-01-22 21:48 on Mar 8, 2015.